How to Debug Statiq Razor Pages
As a C# developer through and through, I love working with tools that let me leverage my existing skills. That's one of the reasons I chose Statiq.Dev as my static site generator-it's built on .NET, and I can write C# code to generate my site. However, debugging the code that generates a Statiq site isn't as straightforward as debugging a typical web application. It requires some additional steps to get everything working smoothly.
As great as the documentation is, there's no substitute for diving into the code yourself and seeing what's happening under the hood. This unique challenge, based on the nature of the solution, requires unique solutions. So, I'm documenting this process to remind myself (and hopefully help others) how to set up debugging for Statiq sites.
TL;DR;
- Disable "Just My Code" in your debugger settings.
- Allow breakpoints in modified source files.
- Configure your IDE to automatically locate .cshtml source files.
- Applies to both Visual Studio and VS Code.
The Challenge
When I first attempted to debug the code that generates my Statiq site, I noticed that my breakpoints in the .cshtml files weren't being hit.
Because Statiq isn't a typical web application-it's a static site generator-the way it compiles and runs code is a bit different than how a typical web app because the console app "generates" html, it isn't an executing web application. This unique challenge requires unique solutions to get the debugging process working smoothly.
After some digging and tweaking, I found the settings that make debugging Statiq generator code as straightforward as debugging any other .NET application.
Disabling "Just My Code" Debugging
The "Just My Code" feature is great for focusing on your own code, but in this case, it was preventing the debugger from stepping into the generated .cshtml files.
In Visual Studio
Tools>Options.- Expand
Debugging>General. - Uncheck "Enable Just My Code".
- Click
OKto save.
Setting Breakpoints in cshtml Files
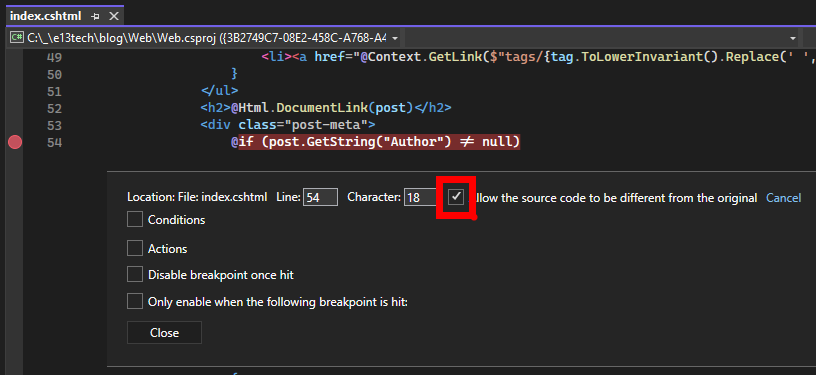
When debugging .cshtml files, simply setting a breakpoint isn't enough due to the nature of Statiq's static site generation process. In Visual Studio, you need to configure your breakpoints to handle source files that might differ from the original version. This is important because Statiq generates code that may not perfectly align with the static .cshtml file, and without this setting, your breakpoints won't be hit.
In the screenshot below, you can see the settings of a newly created breakpoint. Be sure to:
- Right-click the breakpoint and select "Conditions" or "Settings" (depending on your version of Visual Studio).
- Check the option labeled "Allow the source code to be different from the original."
This ensures the breakpoint will be triggered, even if the source file differs from the version used at runtime, which is common when working with generated code like Statiq's. Now when you debug you should get prompted to manually locate the source files. Not the most convenient thing in the work however I rarely need to debug the code so it's a small price to pay for the amount of times I need to do this.
Wrapping Up
Statiq.Dev is a powerful static site generator which I can extend via my peferred language C#, which is a big win in my book. This may not be the most ideal setup for everyone but for purposes I can do what I need and I enjoy being able to tweak it. Hopefully, this guide helps you (and future me) navigate any debugging issues that come up. There's no better way to understand what's happening in your code than by stepping through it yourself.
If you have any other tips or questions, feel free to leave a comment!

